Getting The Most Out Of Mobile App Analytics

One of the most powerful tools available to anyone in the world of mobile apps is mobile app analytics. You can get real-time stats on almost any metric you can think of, and use them to optimize and improve, as your app conquers the charts – and the world!
There’s also a danger lurking here, however. With so much information available, it can be difficult to know where to start, or how to sort useful information from the rest.
In this post we’ll take you through the basics and more advanced elements of mobile app analytics, we’ll approach the app analytics challenge from different perspectives, and we’ll give you actionable tools and insights to ensure that you leverage your mobile app analytics to their full potential.
What Is Mobile App Analytics
In simple terms, mobile app analytics is all the information available to you about how people interact with your app, and how your app performs.
Mobile application analytics is critical to crafting incredible mobile experiences for your users, and ensuring that as many users as possible are exposed to your app’s awesomeness. They allow you to optimize your app experience, ensure potential users are not being disappointed along the way, and that current users are kept engaged.
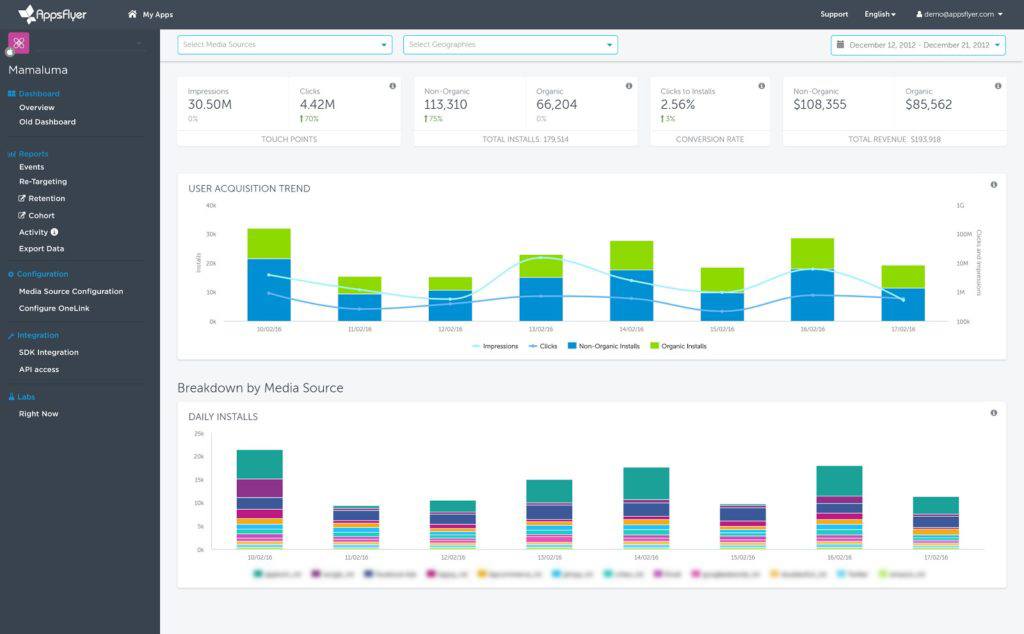
Just like any website has analytics available (through, for example, Google Analytics and Google Tag Manager), every app also has tremendous amounts of data available that can be chopped, sliced and diced to give you an informed view of how your app is doing.
For example, one of the metrics that can be measured is app crashes. If you suddenly see through crash reports that crashes have dramatically increased, you can know immediately that something is wrong, and fix it immediately.
Our ASO experts and Marketing specialists are here to help you achieve success.
In the world of mobile, everything is related, and each element is a critical part of the greater whole. To take the previous app crashes example, this type of problem can impact your app’s ASO (App Store Optimization), as both the Apple and Google app stores take post-install metrics into account.
So without good mobile app analytics, you might see downloads dropping without having a clue what’s causing the decline. With good analytics in place, you’ll immediately see that your App Store Optimization is being impacted, and identify increased crashes as the root cause.
There are three primary uses for mobile analytics:
- Engagement metrics
- Performance metrics
- Revenue metrics
Engagement metrics
Engagement metrics show how users interact with your mobile app, and generally look at how often or a length of time that users take (or don’t take) action with regards to your app.
Engagement metrics are important because they essentially show how much users like your app. If there’s high engagement, you’re doing something right (although there’s always space to optimize!). Low engagement shows that elements of your app need improvement.
The engagement has a high correlation with revenue – but more importantly perhaps, it can show where potential revenue lies. For example, if you have users highly engaged with your app but low revenues, it probably means you should open new revenue streams, like ads or in-app purchases.
Engagement metrics also show the “stickiness” of your app, which is indicative of long-term success. Highly engaged users will keep coming back for more and will likely lead to further high-quality users.
Some key engagement metrics (and ways to improve them) are:
Active users: generally measured in terms of daily active users (DAU) or monthly active users (MAU), this metric shows how often users actively used (usually meaning that users opened) your app – on a daily or monthly basis.
The key value of this metric is that it is much more valuable than vanity metrics such as app installs. You can have 25m mobile app installs, but only 2 active users, as all the others just stopped using your app. On the other hand, some apps have an extremely high active user count, on both a daily and monthly basis, and these tend to be the most successful (no surprises there!).
Improving this metric: the simple answer here is just to make sure that you’ve built a great app. Then again, we’re sure you have, so the next things to look at will be:
- Ensuring the app works smoothly with no crashes
- Incorporating sticky elements within the app to keep users coming back (for example a daily prize that needs to be claimed)
- Gently reminding users to engage through relevant push notification
App retention rate: this metric demonstrates how many users come back to your app and how often. After using the app for the first time, some users will never use it again, while others will keep coming back.
Our ASO experts and Marketing specialists are here to help you achieve success.
Generally, over time, users will drop off, and this is indicated with the retention rate metric. A high retention rate shows that you are adding value to users and that they reciprocally value your app. Similar to retention is churn, which shows the rate at which users abandon the app.
Improving this metric: here again, a good quality app experience is key to high retention and low churn rate.
Performance metrics
Application performance metrics are all about a great experience for your user, from which all other areas of app success flow. An app that performs – both in terms of technical performance as well as meeting user expectations from a function perspective – is an app that is well on its way to tremendous success.
Load speed: there are few things more frustrating than an app that’s really slow to load, or that doesn’t load at all. Load speed and page loads are critical to user experience and is something that app developers need to be highly aware of.

Improving this metric: designing for specific platforms often leads to improved performance, instead of a “one size fits all” app design that while shorter to develop can cost on the performance side. For a more detailed look at ways to improve app speeds, see this piece from DZone.
Crashes: as mentioned previously, crashes can really take a toll on your app’s success. They will negatively impact user experience, retention and churn, and even app store rankings.
Improving this metric: staying on top of your crash reports is really important. Nip the problem in the bud as soon as you find an element that is crashing regularly.
Revenue metrics
It’s money time! Revenue metrics can give detailed insights into where to focus your attention and app marketing efforts, and continually optimize to keep your revenue flow pumping strongly. Some key revenue and revenue-related statistics to stay on top of are:
Lifetime value and cost of user acquisition: lifetime value, or LTV, show how much a user is worth, on average, over the course of their lifetime with your app. Customer acquisition cost, or CAC/CPI (cost per install), shows how much it cost, on average, to acquire a particular user. The greater the gap between your LTV and your CAC, the wider your profit spread.

Improving these metrics: as with mobile app analytics in general, the more specific you can be, the better. Therefore, break your user base down into cohorts, and look at the above metrics based on everything from geo to acquisition channel, user behavior and different types of target user.
No doubt you will unearth some gems, such as a particular geo that has an exceptionally high LTV with a low CAC. You’ll then be able to optimize in these areas without having to reinvent the wheel.
Average revenue per user: if your user base is increasing and your revenue is increasing, everything is great, right? Well, not so fast. This is where average revenue per user comes in.
This metric (revenue over number of users) is an excellent sensitivity metric in that it can indicate early if there’s some kind of issue. In the above example, it’s possible that even though revenue and users are up, average revenue per user is down.
This means that you are not generating the revenues you can be from your increasing user base.
Our ASO experts and Marketing specialists are here to help you achieve success.
Improving this metric: ensure that you are keeping your revenue streams updated in terms of your growing user base. Relying on the same revenue streams might not be cutting it with new users or even old ones. Keep diversifying your revenue streams to ensure that average revenue per user keeps climbing and that adding more users is, in fact, worth it from a business perspective.
Apple Analytics and Google Analytics
Now that we’ve looked at general mobile app analytics, we turn our attention to app store analytics available from the app store giants, namely iOS and Android, or Apple and Google respectively. Both of these platforms provide detailed app analytics that can be used to optimize your app performance.
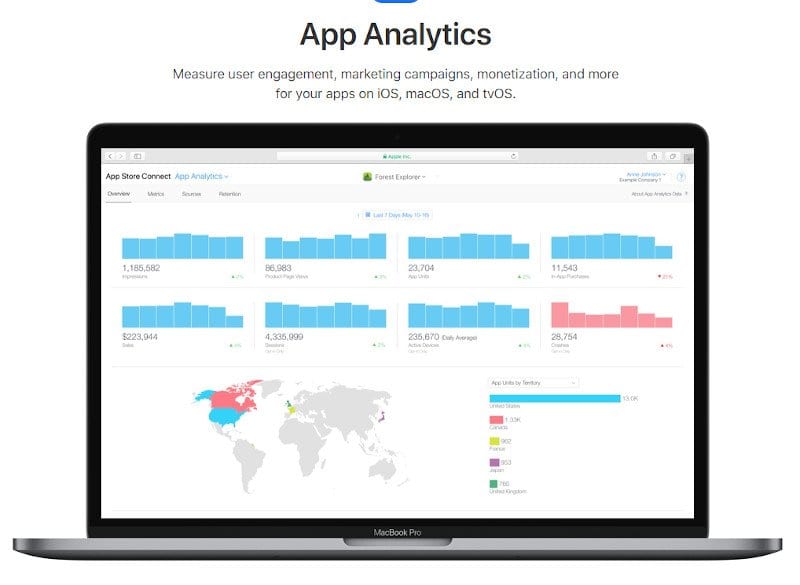
Apple app analytics
Apple analytics, through App Store Connect, shows all the major app metrics for your iOS app analytics, such as downloads and retention. They also show:
- Impressions: how many times your app was viewed in the Featured, Categories, Top Charts, & Search areas of the App Store
- Sessions: when the app has been used for at least 2 seconds
- Sources: including App Referrer, App Store Browse, App Store Search and Web Referrer
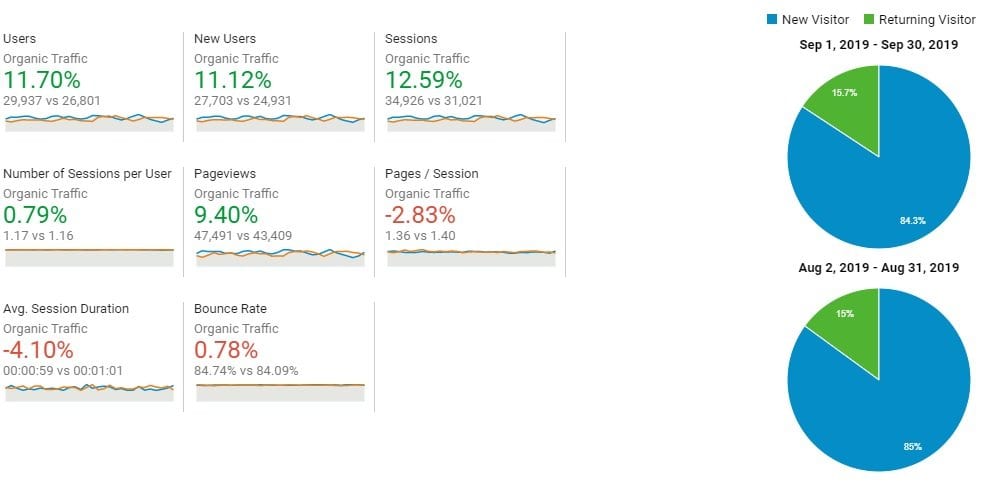
Google app analytics
Google Analytics for mobile apps also provides rich data for analysis. The main features of Google analytics mobile app tracking include:
- Analysis of operating systems and device models
- Number of users and sessions
- Session duration
- User activities
- In-app payments and revenue metrics
- Ability to create customized analytics reports
- Heat maps showing user navigation paths
- Integration with Google Play for conversion tracking
- Filters
- Ability to define goals
Google analytics app tracking helps you understand your Android app analytics and refine and optimize across all your metrics to ensure the success of your Google-listed apps.
Web app analytics
Similar to the above analytics options, there is also web app analytics. A web app works through a smartphone browser, as opposed to a mobile app that’s installed directly on the device itself. Also related is a single-page app or SPA.
An SPA is a type of web app that dynamically rewrites the current page, rather than loading entire new pages from a server. Web app analytics tools track pages and virtual pageviews and give powerful insights into key metrics.
Google Analytics single-page app and web app functionality has been enhanced recently by Google’s App + Web functionality.
As Russell Ketchum, Group Product Manager, Google Analytics writes: “Currently, many businesses measure app engagement with Google Analytics for Firebase and website engagement with Google Analytics.
While each of these products separately offers powerful insights, getting a more unified picture of engagement across your app and website can be a manual and painstaking process. To make this simpler, we’re announcing a new way to measure apps and websites together for the first time in Google Analytics.”
Mobile Analytics Tools
There are some excellent mobile app analytics tools out there to assist you in achieving app success. Included among these are free app analytics tools and open source tools that can ensure you’re up and running immediately. Some of the best tools out there for app analytics include:
App Annie: the gold standard of app analytics, including competitor research. There are some free tools available here, but the core product has some not insignificant costs attached
Mixpanel: gives excellent insights into user behavior and how users are interacting with your app. The starter pack is free and the next package up starts at $779/year.
Pendo: a product-focused analytics tool with great engagement and visibility features
Amplitude: a well-known product analytics tool used by some big-name companies
Our ASO experts and Marketing specialists are here to help you achieve success.
Mobile App Analytics: Metrics To Drive App Success
Mobile app analytics is the beating pulse of your app offering. Keeping these metrics healthy is a full-time job, that requires an interdisciplinary approach to achieve maximum success.
Understanding and optimizing app analytics requires input from design teams, technical teams, marketing teams and experts in ASO and user acquisition.
At Moburst, making the most of your metrics to drive the success of your app is what we do. We’ve received multiple awards for our work, and count as clients some of the biggest names in the app world. What’s more, we’d love to work our magic for you, too.
So get in touch and let’s set up a conversation around your mobile app analytics, and getting more out of them to set you up and achieve your full potential.

Related Articles

Mobile Marketing for SaaS and Subscription Brands

The Complete Guide to Creative Testing for Mobile Ads